

- The ambition: a Manchester-based “No. 10 North”1 regional public sector empowerment, and the biggest council housebuilding programme since the war.
- UK regional pushes in history, however funded, have rarely been able to meaningfully close the gap — but each has created new winners and market opportunities.
- The success of these policies may largely be unimportant: the real question is which companies stand to benefit from the reallocation of government spending and push for increased private capital for UK growth.
On Monday 29th June 2026, Andy Burnham set out his vision of the UK should he be successful in his bid to be the next Prime Minister – what he called “the biggest rebalancing of power our country has seen”.1
He unveiled his concept of “No. 10 North”: a Manchester based extension of Downing Street operations, designed to act as “the nerve centre of a rewired Britain”.1
The substance of his speech rested on three key pillars:
- Utility & public service reform, with more regional control to be taken over essential services
- Reindustrialisation, with explicit support promised for manufacturing in “critical sectors like steel”1
- Regeneration, with a pledge to deliver the biggest council house building programme since the post-war period
While devolution underpinned his message, the key elements of the speech focused on his commitment to operate within “the current fiscal rules”1 and to oversee a reallocation of economic activity across the regions within the UK.
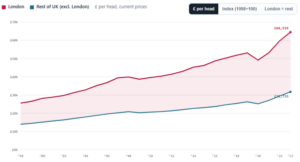
Source: Regional gross value added (balanced) per head and income components – Office for National Statistics
In pledging to “strive for equivalent living conditions in all parts of Britian”1 Burnham invoked Germany’s post-reunification efforts, a programme which costs around EUR2 trillion in state spending between 1990 and 2014.2
Regional strategy in the UK has been through a number of distinct eras:
Post War (1945 -1979)
Policies were introduced including Development Areas and the Hardman dispersal programme which saw the DVLA centralised in Swansea and the Royal Mint relocating to Wales from London. GDP growth averaged 2.5-3% per annum – the strongest sustained period of GDP growth in UK economic history.3
The FT30 Index (the leading index during the period) tripled between 1945 to 1968 with index constituents including manufacturing businesses headquartered across the Midlands, North and Scotland.4
Divergence (1979 – 1997)
Regional grants and initiatives were withdrawn. The FTSE 100 launched in 1984 at 1,000 which resulted in policy spending becoming more market driven. The 1986 “Big Bang” introduced financial deregulation which concentrated economic activity in London.
By 1999 the FTSE 100 had reached nearly 7,000 driven overwhelmingly by financial services, oil majors and pharmaceuticals led out of London headquarters.
Manufacturing contribution to gross value added fell from c23% to c17%.
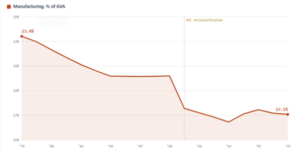
Source: Bank of England, A Millennium of Macroeconomic Data (Thomas & Dimsdale), v3.1, sheet A16 “Industry GVA shares by SIC.” Values are manufacturing’s share of gross value added at current prices — the standard basis for “manufacturing’s share of GDP” (GDP adds taxes less subsidies on products, which shifts the level marginally but not the trend).
New Labour (1997 – 2010)
Renewed devolution of powers to Scotland and Wales, combined with public spending expansion that benefitted regions with higher public sector employment.
Note: the FTSE 250 is often considered to be a better barometer of the UK economy as it represents a larger proportion of more domestic business.
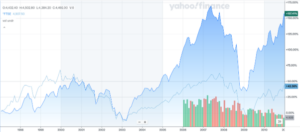
FTSE 250 vs FTSE 100 (1997 to 2010). The FTSE 250 rose at a quicker rate between 2003 – 2008 than the FTSE 100 under New Labour. After the credit crisis hit in 2008, the FTSE 250 again recovered quicker to finish the period with over 100% better growth than the FTSE 100 by the end of 2010.
Northern Powerhouse & Levelling Up (2014 – 2024)
A period of austerity which constrained ambitions of regional development – HS2 becoming emblematic of a growing gap between ambitions and delivered investment. Boris Johnson’s £5bn Levelling Up fund proved to lack impact relative to the scale of the challenge.
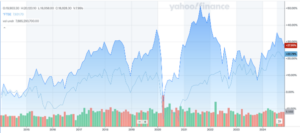
FTSE 250 vs FTSE 100 (2014 to 2024). Both indices grew at similar rates up to the outbreak of Covid-19 in early 2020. FTSE 250 saw an acceleration of returns post government intervention, before a significant correction in the latter half of 2021.
Burnham will likely lean on three key levers
- Reallocation of fiscal resources. Burnham committed that “every pound raised from taxpayers will work harder” explicitly referencing the Defence Investment Plan, before adding a commitment to reallocating with “proper social value weighting… to make sure British-based companies are in a better position to win contracts.”1 Such policies may create opportunities for well-known defence names with nationwide manufacturing footprints.
- Planning reform. Burnham stated that “No 10 North will oversee the biggest council house building programme since the post-war period”1 using vacant public land to reduce costs.
- Redirection of Private Capital. Burnham outlined how he would back “scientists, technologists, entrepreneurs and creatives”1 through establishing Good Growth Funds.
Bowmore portfolios
What history illustrates is that each regional refocus simply redraws the map of winners. The Post-War decades had their compounders in the industrial constituents of the FT30; the Divergence relocated the winners’ circle to London’s financials, energy and pharma; New Labour’s spending years brought success through mid-cap companies and the FTSE 250. While the political landscape shifted, there always remained a path to success.
The question is which businesses will benefit from policy reform and the growth private capital that Burnham must attract. His levers give us a sense of what could prosper: defence procurement weighted toward British production, the construction and materials chain behind a council-housing programme, and the utilities, energy and transport networks that devolved regions would be handed to run. Some investments held within Bowmore portfolios, including the Redwheel UK Equity Income fund, have exposure to a range of UK-listed companies that may participate in these themes. Exposure to these areas does not guarantee positive investment performance.
Furthermore, the companies that continue to grow through political and macroeconomic regime change are rarely those tied to the success of one-off policies — they are the ones with quality fundamentals: pricing power, structural demand and the balance-sheet strength to keep reinvesting.
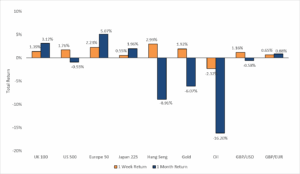
Source: AlphaTerminal data as at 03/07/2026
The value of your investments can go down as well as up, so you could get back less than you invested. Past performance is not a guide to future performance.
Sources
1 Manchester Evening News, 2026
2 www.spiegel.de/international/europe/
3 Bank of England, A Millennium of Macroeconomic Data
4 Financial Times 30 Index